
Active or Passive? The Surprising Truth About Fund Performance in Canada
The debate between active and passive investment management remains central to the Canadian financial industry. While past performance is no guarantee of future results, the S&P Dow Jones Indices' mid-year 2025 SPIVA® Canada Scorecard provides informative data for the ongoing contest. The SPIVA Canada Scorecard measures the performance of Canadian actively managed funds against their respective benchmarks over various time horizons, covering large-, mid-, and small-cap segments, as well as international and global equity funds. A comprehensive methodology of SPIVA Scorecard can be found here.
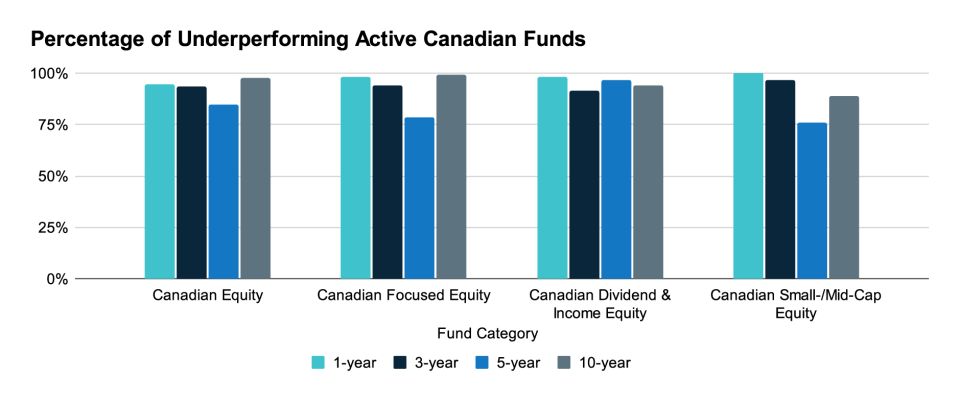
Even with a positive first half of the year in Canadian markets, a significant majority of actively managed funds found it challenging to keep pace with their benchmarks. Over the past year ending June 30 2025, nearly 95% of Canadian Equity funds underperformed the S&P/TSX Composite Index1. (Exhibit 1)
1 Source: SPIVA Canada Scorecard Mid-Year 2025 Factor Indices
| Fund Category | Comparison Index |
|
Canadian Equity |
S&P/TSX Composite Index |
| Canadian Focused Equity | 50% S&P/TSX Composite + 25% S&P 500 (CAD) + 25% S&P EPAC LargeMid Cap (CAD) |
| Canadian Dividend & Income Equity | S&P/TSX Canadian Dividend Aristocrats Index |
| Canadian Small-/Mid-Cap Equity | S&P/TSX Completion Index |
Source: SPIVA Canada Scorecard Mid-Year 2025
This trend of underperformance was consistent across various categories, with a cross-category average of over 90% of active funds trailing their benchmarks. The 2025 underperformance was not a one-time event; it looks to be a continuation of a long-standing pattern.
While the S&P/TSX Composite Index climbed 10.2% in H1 2025, the average Canadian equity funds gained 9.1% on an asset-weighted basis. Over longer periods, the underperformance rates become even more pronounced. For instance, the Canadian equity funds' underperformance rate steadily increases from 95% in 1-year period to 98% in 10-year period.
There appears to be more outperformance opportunities in Canadian Dividend & Income equity funds and Small-/Mid-cap equity funds. However, over the longer term (> 5-year), only around 5% (Canadian Dividend & Income) and 18% (Canadian Small-/Mid-Cap) of active managers generated alpha against the respective benchmarks. The empirical evidence suggests that active fund managers in Canada, for the most part, continue to underperform their benchmarks across all time horizons.
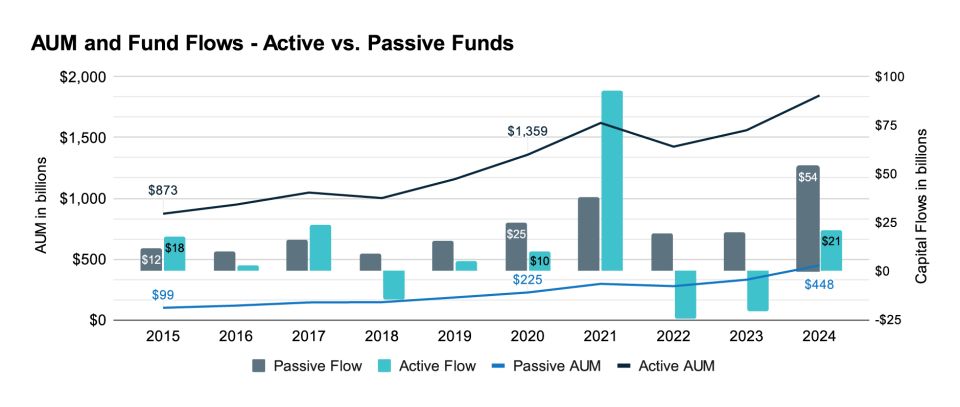
Given the evidence of underperformance, comparing the Assets Under Management (AUM) and asset flows of active vs. passive retail funds (mutual funds and exchange-traded funds) in the Canadian market further supplements the findings.
Based on PWL Capital's 2024 year-end report2, passive investment funds' growth in Canada has outpaced active funds over the last decade. Passive funds' market share has grown from 10% in 2015 to 20% in 2024, representing approximately $350 billion in added AUM over that period. Additionally, in seven out of ten years from 2015 to 2024, flows into passive funds were greater than active funds, resulting in more than $100 billion of cumulative net inflows. The disparity in favor of passive funds has grown even more pronounced with a major inflow of capital since 2022.
Source: "The Passive vs. Active Fund Monitor (Year-end 2024)" PWL Capital Inc
2 Source: "The Passive vs. Active Fund Monitor (Year-end 2024)" PWL Capital Inc.
The challenging pursuit of alpha is not contained to the Canadian equity space, but is rather a common phenomenon across the globe. A wide range of investors (retail, do-it-yourself, institutional) look for a good balance of active investments and index-based, passive investments as each strategy can have specific roles in a portfolio. The current state and trends observed in Canada suggest strong growth in passive fund investing.
-
Copyright © 2025 TSX Inc. All rights reserved. Do not copy, distribute, sell or modify this document without TSX Inc.'s prior written consent. This information is provided for information purposes only. Neither TMX Group Limited nor any of its affiliated companies guarantees the completeness of the information contained in this publication, and we are not responsible for any errors or omissions in or your use of, or reliance on, the information. This publication is not intended to provide legal, accounting, tax, investment, financial or other advice and should not be relied upon for such advice. The information provided is not an invitation to purchase securities listed on Toronto Stock Exchange and/or TSX Venture Exchange. TMX Group and its affiliated companies do not endorse or recommend any securities referenced in this publication. TMX, the TMX design, TMX Datalinx, TMX Group, Toronto Stock Exchange, TSX, TSX Venture Exchange, and TSXV are the trademarks of TSX Inc. All other trademarks used are the property of their respective owners.
*The S&P/TSX Indices are products of S&P Dow Jones Indices LLC ("SPDJI") and TSX Inc. ("TSX"). S&P® is a registered trademark of S&P Global, Inc. or its affiliates ("S&P"); Dow Jones® is a registered trademark of Dow Jones Trademark Holdings LLC ("Dow Jones"); and TSX® is a registered trademark of TSX. SPDJI, Dow Jones, S&P and TSX do not sponsor, endorse, sell or promote any products based on the Indices and none of such parties make any representation regarding the advisability of investing in such product(s) nor do they have any liability for any errors, omissions or interruptions of the Indices or any data related thereto.
The views and opinions expressed in this article are those of TSX Inc. and do not necessarily reflect the views and opinions of S&P, Dow Jones, or their affiliates.